
 Yahoo Finance
 StoneCo (NASDAQ:STNE) Has More To Do To Multiply In Value Going Forward
Did you know there are some financial metrics that can provide clues of a potential multi-bagger? Amongst other things, we'll want to see two things; firstly, a growing return on capital employed (ROCE) and secondly, an expansion in the company's amount of capital employed. This shows us that it's a compounding machine, able to continually reinvest its earnings back into the business and generate higher returns. However, after investigating StoneCo (NASDAQ:STNE), we don't think it's current trends fit the mold of a multi-bagger.
Understanding Return On Capital Employed (ROCE)
For those who don't know, ROCE is a measure of a company's yearly pre-tax profit (its return), relative to the capital employed in the business. To calculate this metric for StoneCo, this is the formula:
Return on Capital Employed = Earnings Before Interest and Tax (EBIT) ÷ (Total Assets - Current Liabilities)
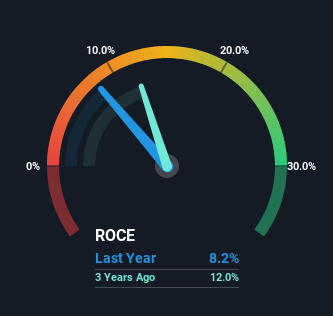
0.082 = R$1.4b ÷ (R$41b - R$23b) (Based on the trailing twelve months to March 2022).
Thus, StoneCo has an ROCE of 8.2%. In absolute terms, that's a low return and it also under-performs the IT industry average of 12%.
Check out our latest analysis for StoneCo
In the above chart we have measured StoneCo's prior ROCE against its prior performance, but the future is arguably more important. If you'd like to see what analysts are forecasting going forward, you should check out our free report for StoneCo.
What Does the ROCE Trend For StoneCo Tell Us?
There are better returns on capital out there than what we're seeing at StoneCo. Over the past five years, ROCE has remained relatively flat at around 8.2% and the business has deployed 1,318% more capital into its operations. Given the company has increased the amount of capital employed, it appears the investments that have been made simply don't provide a high return on capital.
On a side note, StoneCo has done well to reduce current liabilities to 57% of total assets over the last five years. This can eliminate some of the risks inherent in the operations because the business has less outstanding obligations to their suppliers and or short-term creditors than they did previously. We'd like to see this trend continue though because as it stands today, thats still a pretty high level.
What We Can Learn From StoneCo's ROCE
As we've seen above, StoneCo's returns on capital haven't increased but it is reinvesting in the business. And investors may be expecting the fundamentals to get a lot worse because the stock has crashed 70% over the last three years. Therefore based on the analysis done in this article, we don't think StoneCo has the makings of a multi-bagger.
One more thing to note, we've identified 1 warning sign with StoneCo and understanding it should be part of your investment process.
For those who like to invest in solid companies, check out this free list of companies with solid balance sheets and high returns on equity.
Have feedback on this article? Concerned about the content? Get in touch with us directly. Alternatively, email editorial-team (at) simplywallst.com.
This article by Simply Wall St is general in nature. We provide commentary based on historical data and analyst forecasts only using an unbiased methodology and our articles are not intended to be financial advice. It does not constitute a recommendation to buy or sell any stock, and does not take account of your objectives, or your financial situation. We aim to bring you long-term focused analysis driven by fundamental data. Note that our analysis may not factor in the latest price-sensitive company announcements or qualitative material. Simply Wall St has no position in any stocks mentioned.
