
 Yahoo Finance
 Old Dominion Freight Line's (NASDAQ:ODFL) five-year earnings growth trails the fantastic shareholder returns
While Old Dominion Freight Line, Inc. (NASDAQ:ODFL) shareholders are probably generally happy, the stock hasn't had particularly good run recently, with the share price falling 19% in the last quarter. But that doesn't undermine the fantastic longer term performance (measured over five years). In fact, during that period, the share price climbed 303%. Impressive! So it might be that some shareholders are taking profits after good performance. But the real question is whether the business fundamentals can improve over the long term.
After a strong gain in the past week, it's worth seeing if longer term returns have been driven by improving fundamentals.
Check out our latest analysis for Old Dominion Freight Line
To paraphrase Benjamin Graham: Over the short term the market is a voting machine, but over the long term it's a weighing machine. By comparing earnings per share (EPS) and share price changes over time, we can get a feel for how investor attitudes to a company have morphed over time.
During five years of share price growth, Old Dominion Freight Line achieved compound earnings per share (EPS) growth of 33% per year. This EPS growth is remarkably close to the 32% average annual increase in the share price. That suggests that the market sentiment around the company hasn't changed much over that time. Indeed, it would appear the share price is reacting to the EPS.
You can see below how EPS has changed over time (discover the exact values by clicking on the image).
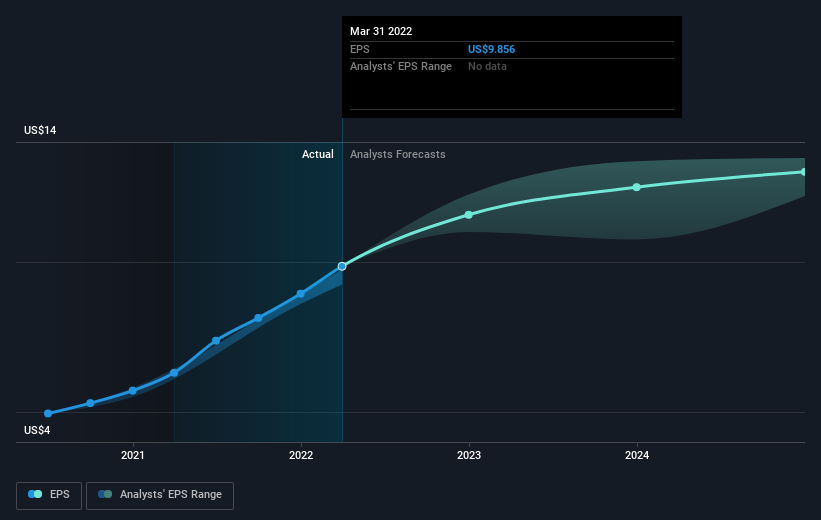
We know that Old Dominion Freight Line has improved its bottom line lately, but is it going to grow revenue? Check if analysts think Old Dominion Freight Line will grow revenue in the future.
What About Dividends?
When looking at investment returns, it is important to consider the difference between total shareholder return (TSR) and share price return. The TSR is a return calculation that accounts for the value of cash dividends (assuming that any dividend received was reinvested) and the calculated value of any discounted capital raisings and spin-offs. So for companies that pay a generous dividend, the TSR is often a lot higher than the share price return. We note that for Old Dominion Freight Line the TSR over the last 5 years was 310%, which is better than the share price return mentioned above. And there's no prize for guessing that the dividend payments largely explain the divergence!
A Different Perspective
It's nice to see that Old Dominion Freight Line shareholders have received a total shareholder return of 2.1% over the last year. And that does include the dividend. However, the TSR over five years, coming in at 33% per year, is even more impressive. The pessimistic view would be that be that the stock has its best days behind it, but on the other hand the price might simply be moderating while the business itself continues to execute. Before spending more time on Old Dominion Freight Line it might be wise to click here to see if insiders have been buying or selling shares.
If you are like me, then you will not want to miss this free list of growing companies that insiders are buying.
Please note, the market returns quoted in this article reflect the market weighted average returns of stocks that currently trade on US exchanges.
Have feedback on this article? Concerned about the content? Get in touch with us directly. Alternatively, email editorial-team (at) simplywallst.com.
This article by Simply Wall St is general in nature. We provide commentary based on historical data and analyst forecasts only using an unbiased methodology and our articles are not intended to be financial advice. It does not constitute a recommendation to buy or sell any stock, and does not take account of your objectives, or your financial situation. We aim to bring you long-term focused analysis driven by fundamental data. Note that our analysis may not factor in the latest price-sensitive company announcements or qualitative material. Simply Wall St has no position in any stocks mentioned.
